From Canopy to Carbon: How the BIOMASS Satellite is Closing the Gap

The forest carbon sector has operated for decades with a fundamental contradiction at its core: despite being able to detect deforestation from space with impressive precision, our ability to measure how much carbon a standing forest actually contains has remained stubbornly limited. For an industry where carbon estimates underpin everything from REDD+ payments to voluntary market credits, that gap continues to pose a serious credibility problem.
With the launch of ESA’s BIOMASS Satellite, however, that gap should finally begin to close. Launched in April 2025, BIOMASS represents the most significant step forward in forest remote sensing in a generation. To understand why, it helps to understand what we have been working with until now.
The Carbon-Canopy Gap
Optical satellites, such as Landsat, Sentinel-2, and their predecessors, have been the workhorses of remote sensing for decades. While they are excellent at detecting forest cover, mapping land use change, and tracking large-scale deforestation, what they cannot do is see inside the canopy. They measure reflected light from the uppermost layer of vegetation, which provides rich spectral information about forest health and extent, but tell us relatively little about the woody biomass stored in trunks and large branches below.
That woody biomass is where the carbon is. A dense tropical forest and a moderately dense one can look near-identical from an optical sensor, yet differ substantially in carbon stock. Optical-only biomass models saturate at approximately 150 Mg per hectare, precisely the threshold at which tropical forests become most relevant to carbon accounting.
Synthetic aperture radar (SAR) systems like Sentinel-1, operating at C-band (around 5 cm wavelength), penetrate the canopy to some degree, interacting with branches and vegetation structure rather than just surface reflectance. Longer wavelength L-band systems, such as ALOS-PALSAR, penetrate further still. However, even L-band sensors saturate in dense tropical forest conditions, and the fundamental limitation has remained: none of these systems can reliably interact with the large woody components that dominate carbon storage in mature forests. As wavelength increases, the scattering saturation threshold rises, and the correlation between radar backscatter and biomass improves, but the long-wavelength satellites capable of deeper penetration have been largely commercial and inaccessible for routine conservation applications.
The consequence has been that biomass estimates in the world's most carbon-dense forests, the Amazon, the Congo Basin, and the forests of Southeast Asia, have carried the highest uncertainties. These regions are also subject to persistent cloud cover, which disrupts optical monitoring further, and are precisely where the most significant carbon stocks and deforestation pressures coincide.
How BIOMASS is Different
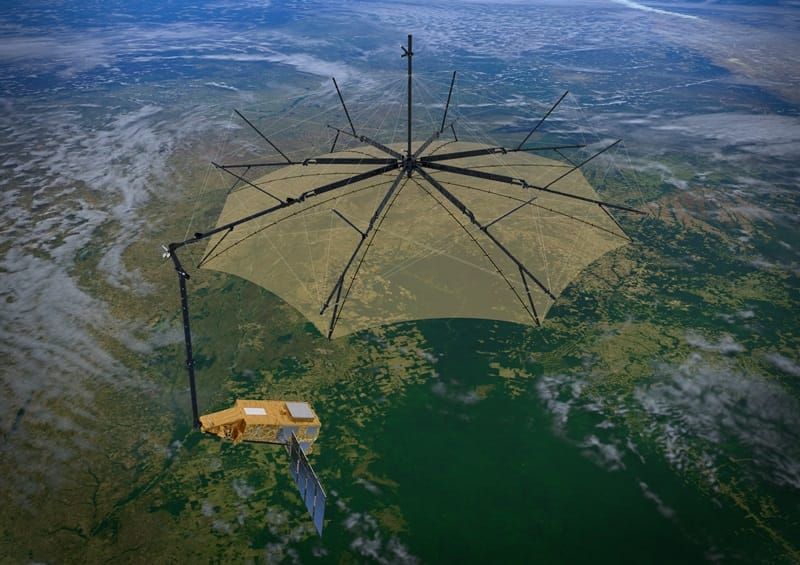
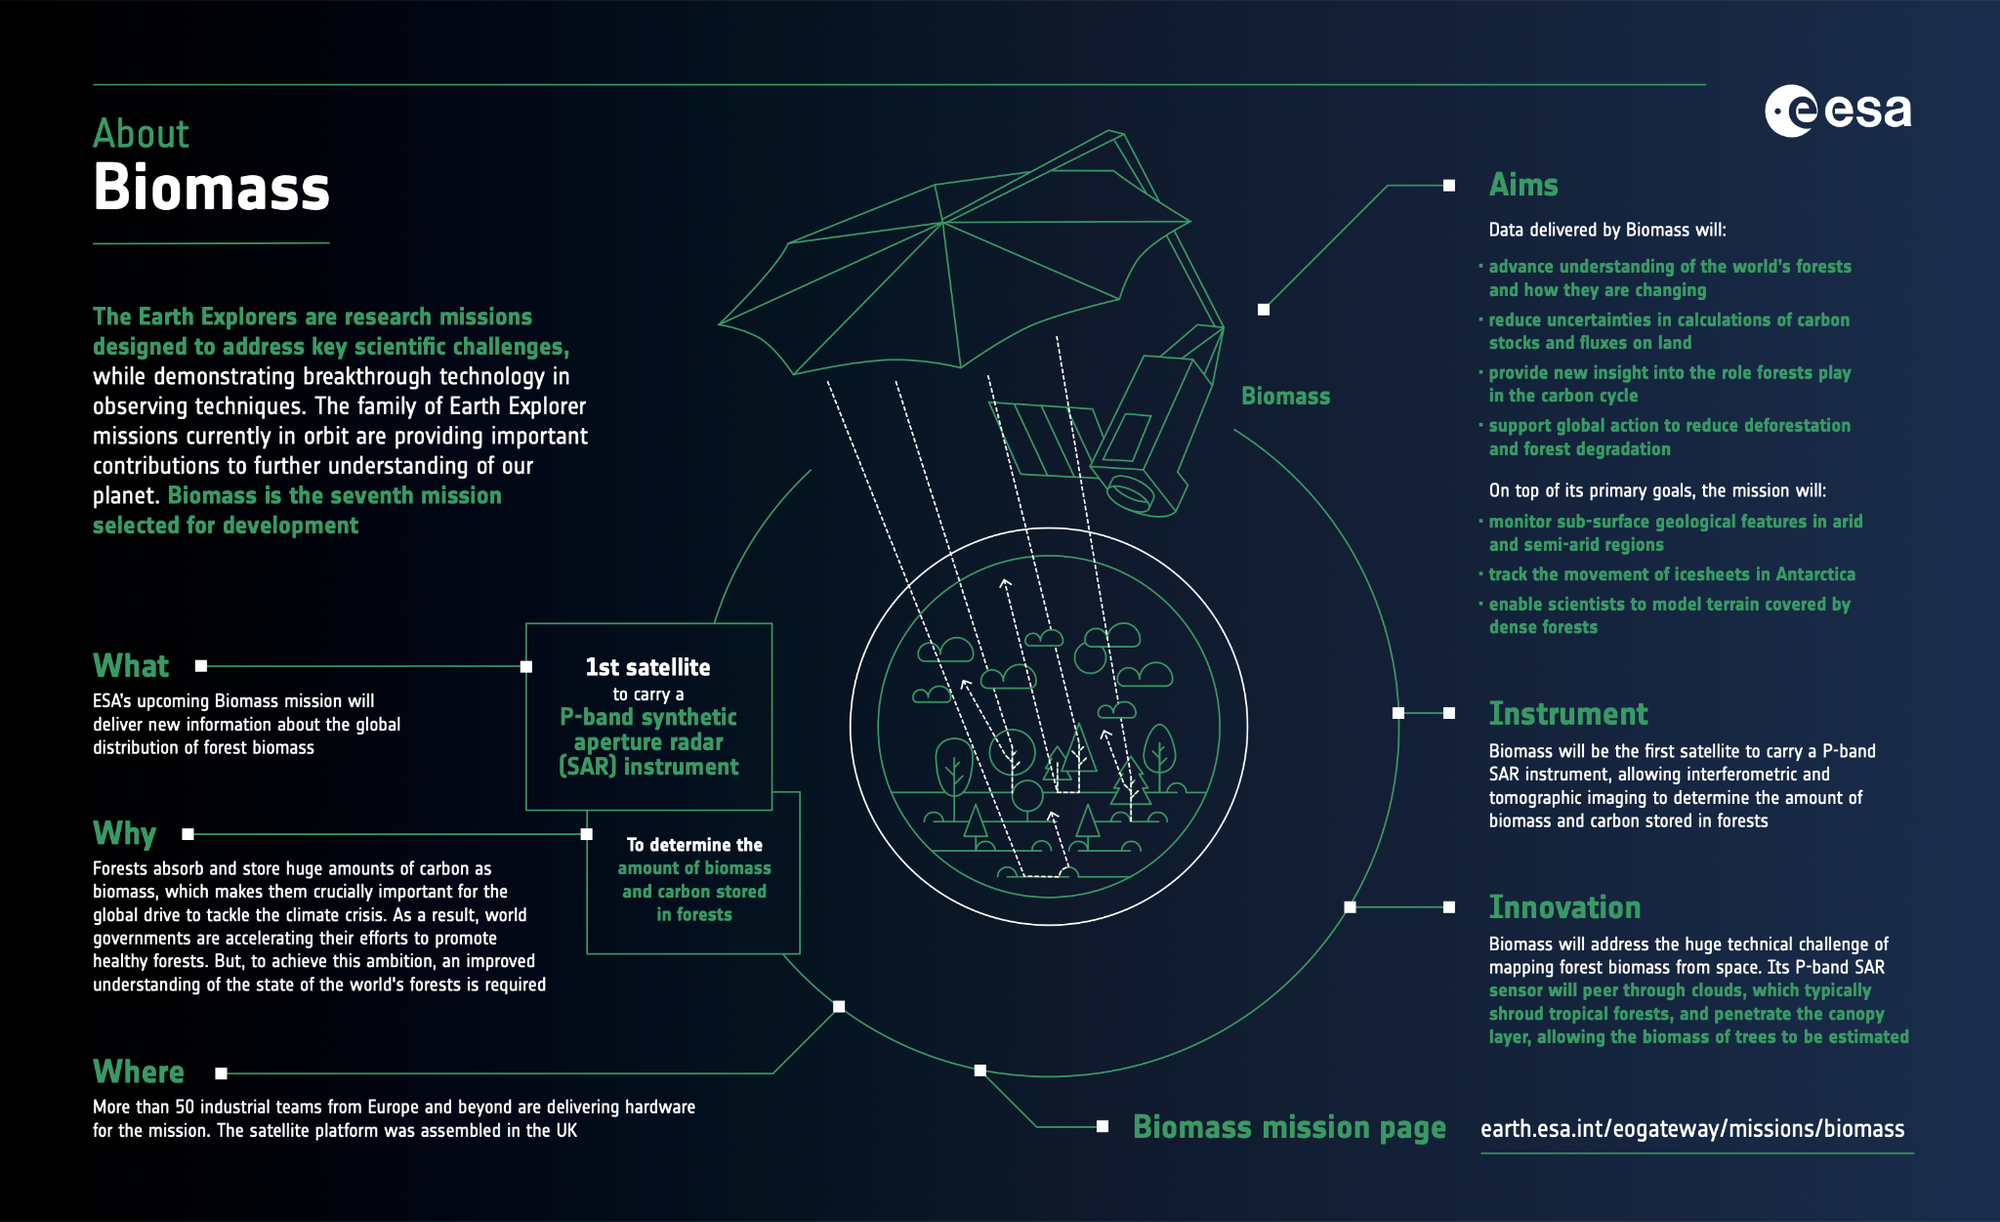
ESA's BIOMASS satellite launched on 29 April 2025 from Kourou, French Guiana, aboard a Vega-C rocket, developed by Airbus Defence and Space. It completed its commissioning phase in January 2026, at which point its data was made openly and freely available, with Level-2 science products in phased release through 2026.
The secret to BIOMASS' value is that it carries the first fully polarimetric P-band synthetic aperture radar ever placed in orbit. P-band operates at approximately 70 cm wavelength, an order of magnitude longer than C-band (with "P" being the label given to this specific range of wavelengths covered). At this wavelength, the radar signal passes through the entire forest canopy and interacts primarily with trunks and large branches, the dominant carbon store in mature forest ecosystems.
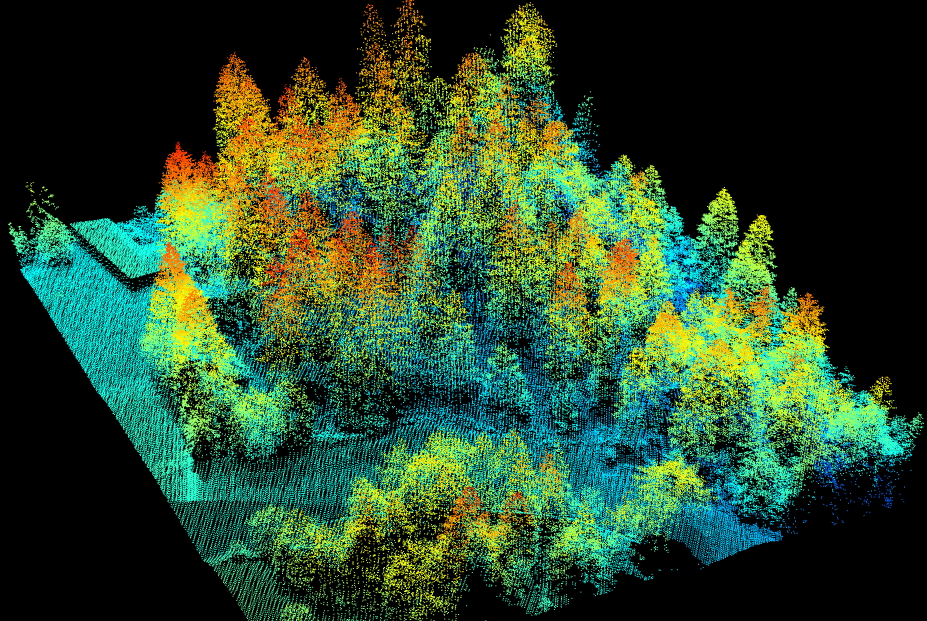
The satellite operates across three complementary modes: polarimetric SAR (PolSAR), polarimetric interferometry (Pol-InSAR), and tomographic SAR (TomoSAR). Together, these allow BIOMASS to retrieve not simply a bulk estimate of above-ground biomass density, but also forest height and the full three-dimensional vertical structure of the canopy. SAR tomography is particularly powerful in this context: by resolving the vertical distribution of backscatter, it can distinguish between canopy layers in dense multi-layered tropical forests where conventional radar sees only a single saturated signal.
The accuracy improvements are significant. Studies using airborne P-band TomoSAR data, the direct precursor to BIOMASS observations, have achieved average relative uncertainty of less than 10% across the biomass range of 200 to 500 Mg per hectare, with AGB estimation improving to less than 7% of the mean when tomographic forest height and backscatter are combined. This covers the high-biomass tropical forest range where previous satellite systems provided their weakest estimates.
Operationally, BIOMASS delivers global maps of forest biomass and height at 200 m resolution and forest disturbance maps at 50 m resolution, updated every six months. Coverage extends from 70 degrees North to 56 degrees South. Being a radar system, it images continuously through cloud cover, removing the systematic data gap that has long undermined monitoring in tropical regions.
The Challenges BIOMASS Can Address
Beyond the measurement accuracy improvements, BIOMASS targets several specific problems that have hampered forest carbon work.
The degradation gap. Deforestation, the complete removal of forest cover, is detectable with optical satellite systems. Forest degradation is not. Selective logging, understory burning, and edge effects can substantially reduce a forest's carbon stock while leaving the upper canopy visually intact. This has been one of the most persistent weaknesses in existing MRV frameworks, particularly for REDD+ projects where degradation rather than outright clearance is often the primary threat. BIOMASS's penetrating P-band radar can detect structural thinning and changes in woody biomass even when the canopy appears continuous from above, offering a direct route to quantifying degradation-related emissions for the first time at global scale.
Uncertainty in carbon flux estimates. The BIOMASS mission's primary scientific objective is to reduce major uncertainties in calculations of carbon stocks and fluxes associated with land use change, forest degradation, and regrowth. These uncertainties feed directly into national greenhouse gas inventories submitted under the Paris Agreement and UNFCCC frameworks. More accurate input data means more credible national reporting and better-informed climate policy.
Carbon market integrity. The voluntary carbon market has faced significant scrutiny over the reliability of forest carbon estimates. Forestry and land use projects represent 37% of all carbon credit retirements in 2025, with REDD+ accounting for 25% of the total. At this scale, systematic overestimation in baseline or project biomass figures has material financial and reputational consequences. Freely available, globally consistent, satellite-derived biomass data provides an independent cross-check against project-level estimates that have historically relied on modelled allometric relationships and sparse ground plot networks.
The AI and Machine Learning Dimension
One of the most promising aspects of the BIOMASS data is the advances it will catalyse when combined with machine learning and AI. P-band TomoSAR produces rich, multi-dimensional backscatter profiles across multiple polarisations and height layers. This high-dimensional, spatially continuous signal is well suited to machine learning methods that can identify complex non-linear relationships between radar observables and ground-measured biomass. Random forest models applied to airborne P-band data at tropical forest sites in Gabon have already demonstrated strong sensitivity to forest height and above-ground biomass, particularly when combined with GEDI LiDAR observations to parametrise the models. These workflows will scale considerably with operational BIOMASS data.
The most promising near-term direction is multi-source fusion: combining BIOMASS P-band observations with NASA's GEDI spaceborne LiDAR for canopy height, Sentinel-2 for spectral and optical context, and Sentinel-1 C-band for complementary radar information. Machine learning serves as the integration layer, learning to combine the strengths of each data source while compensating for the limitations of any single one. Attention-based deep learning architectures fusing GEDI, Sentinel-1, ALOS-2, and Sentinel-2 already outperform conventional random forest algorithms for biomass estimation in terms of both accuracy and bias. Adding BIOMASS P-band as a core input to such architectures is a logical and likely high-impact next step.
One of the most practically significant applications is downscaling. BIOMASS's 200 m native resolution is well suited to national and global-scale carbon accounting, but is too coarse for project-level MRV where spatial precision matters for baseline and additionality assessments. ML-based downscaling, using Sentinel-2 imagery or aerial data as high-resolution spatial texture guides, can push biomass estimates to 10 m resolution or finer. This technique is already well established using GEDI footprint data extrapolated across continuous Sentinel imagery. BIOMASS provides a denser and physically more robust input signal than GEDI's sparse sampling, which should improve the quality and consistency of downscaled products considerably.
In terms of concrete outputs, the combination of BIOMASS and machine learning could realistically support several capabilities that the sector currently lacks. Near-real-time national forest carbon inventories updated twice yearly, replacing costly and slow ground-based survey programmes. Automated degradation alert systems that detect selective logging or fire damage in radar time series before it is visible in optical imagery. And high-integrity MRV pipelines for carbon projects that replace modelled biomass baselines with directly measured change detection, substantially reducing the verification uncertainty that currently inflates permanence buffers and discounts credit values.
Multi-source fusion stacks combining optical, SAR, and LiDAR data with machine learning already achieve mean R-squared values above 0.83 and RMSE below 25 Mg per hectare in research settings. Incorporating P-band as a core input should push accuracy further, particularly in the high-biomass tropical forest environments that have always been the weakest point of existing remote sensing approaches, and the most important for the carbon and conservation sector.
Looking Ahead
BIOMASS does not resolve every challenge in forest carbon measurement. Its 200 m baseline resolution will need ML-based refinement for project-scale applications. Ground truth networks remain essential for calibration and validation. And, the Level-2 science products are still rolling out, meaning practitioners should monitor ESA's data release schedule closely through 2026.
What it does provide, for the first time, is a physically grounded, globally consistent, freely available measurement of the woody biomass that constitutes forest carbon storage, from orbit, through cloud cover, across the full range of tropical forest densities where uncertainty has been greatest. For those working in forest carbon, conservation finance, or national MRV systems, it represents a material improvement in the evidentiary foundation on which the entire sector depends.
The data is available now. The machine learning workflows to exploit it are mature. The only question now is how quickly the tools to translate BIOMASS' observations into verified, actionable carbon intelligence will follow.