Geospatial Foundation Models: A New Era for Forest Species Mapping from Space

Through the use of Geospatial Foundation Models, it is possible to map 18 distinct tree species across an entire Alpine province from satellite data alone, using less than 5% of the training data that conventional methods do. That is the headline finding from new research published in Science of Remote Sensing by forestmap.ai’s CEO James Ball and co-researchers from the University of Cambridge and Fondazione Edmund Mach [1].
The result matters because knowing which species are growing where is the data layer that carbon registries, EUDR compliance teams, and biodiversity finance frameworks are all, in different ways, asking for.
In this post we’ll break down the fundamentals of what geospatial foundation models actually are, the findings of the newly published paper, and why they’re set to change the economics of forest monitoring.
Why satellites have struggled to tell one tree from another
As we’ve discussed previously in our post on the BIOMASS Satellite, accurate, up-to-date regional maps of tree species are essential for biodiversity assessment, carbon estimation, and evidence-based forest management, because species composition regulates productivity, disturbance susceptibility, and the delivery of key ecosystem services [2]. Yet producing these maps has always been hard.
Standard satellite sensors like Sentinel-2 provide broad spectral bands that are often insufficient to detect the subtle canopy differences associated with species-specific leaf biochemistry and pigment concentrations [3]. At 10 metre resolution, pixels frequently capture multiple tree crowns at once, meaning a Norway spruce and a silver fir occupying the same pixel can prove incredibly difficult for a conventional model to tell apart. Mountain forests compound the problem further: steep terrain introduces lighting distortions, snow seasonality disrupts seasonal signals, and sharp elevational gradients mean the same species can look different at 600 metres and 1,800 metres [4].
Multi-season time series can help, but processing them is cumbersome and cloud cover creates persistent gaps [5]. Fusing radar and optical data can help, but has historically required bespoke pipelines for every new region or sensor combination [6]. The result is that most existing forest maps are only able to tell you that there are trees, but not what trees they may be. Field inventories remain the gold standard for species data, but their sparse coverage and high per-unit cost limit their utility at landscape scale [7].
The research question Ball et al. (2026) set out to answer was whether the new class of AI model — Geospatial Foundation Models (GFMs) — could close that gap.
What is a Geospatial Foundation Model?
Imagine learning a foreign language by reading millions of unlabelled books without a dictionary. Instead of memorising translated vocabulary, you would naturally absorb the underlying grammar, sentence structures, and context. By the end, you’d have a deep, intuitive grasp of how the language works much like children do as native speakers. Then, when someone finally shows you some translated phrases, you would very quickly master the dialect.
Geospatial foundation models (GFMs) do the exact same thing for the Earth’s surface. Traditional machine learning models are like flashcards: they are trained strictly on labelled examples ("this pixel is a Norway spruce"). GFMs, by contrast, are pre-trained on petabytes of multi-sensor satellite imagery across years of seasonal changes without any human labels [8]. By observing how light, radar, terrain, and seasonality interact over time, the model builds a rich internal "grammar" of the landscape. Instead of being told "this pixel is a forest" or "this pixel is a city," they learn to recognise the characteristic spectral and temporal signatures of different surfaces by observing how those surfaces behave over time, across seasons, and across sensor types.
The output of this process is an embedding: a compact numerical fingerprint for each pixel that encodes its spectral identity, seasonal dynamics, and cross-sensor relationships into a fixed-length vector (effectively a multidimensional numerical signature) [8]. Crucially, pixels with similar underlying surface properties, such as two patches of European larch at similar elevations, end up with similar fingerprints. Pixels that are ecologically or structurally different end up further apart in what researchers call the embedding space. This geometry is the foundation on which species classification is built.
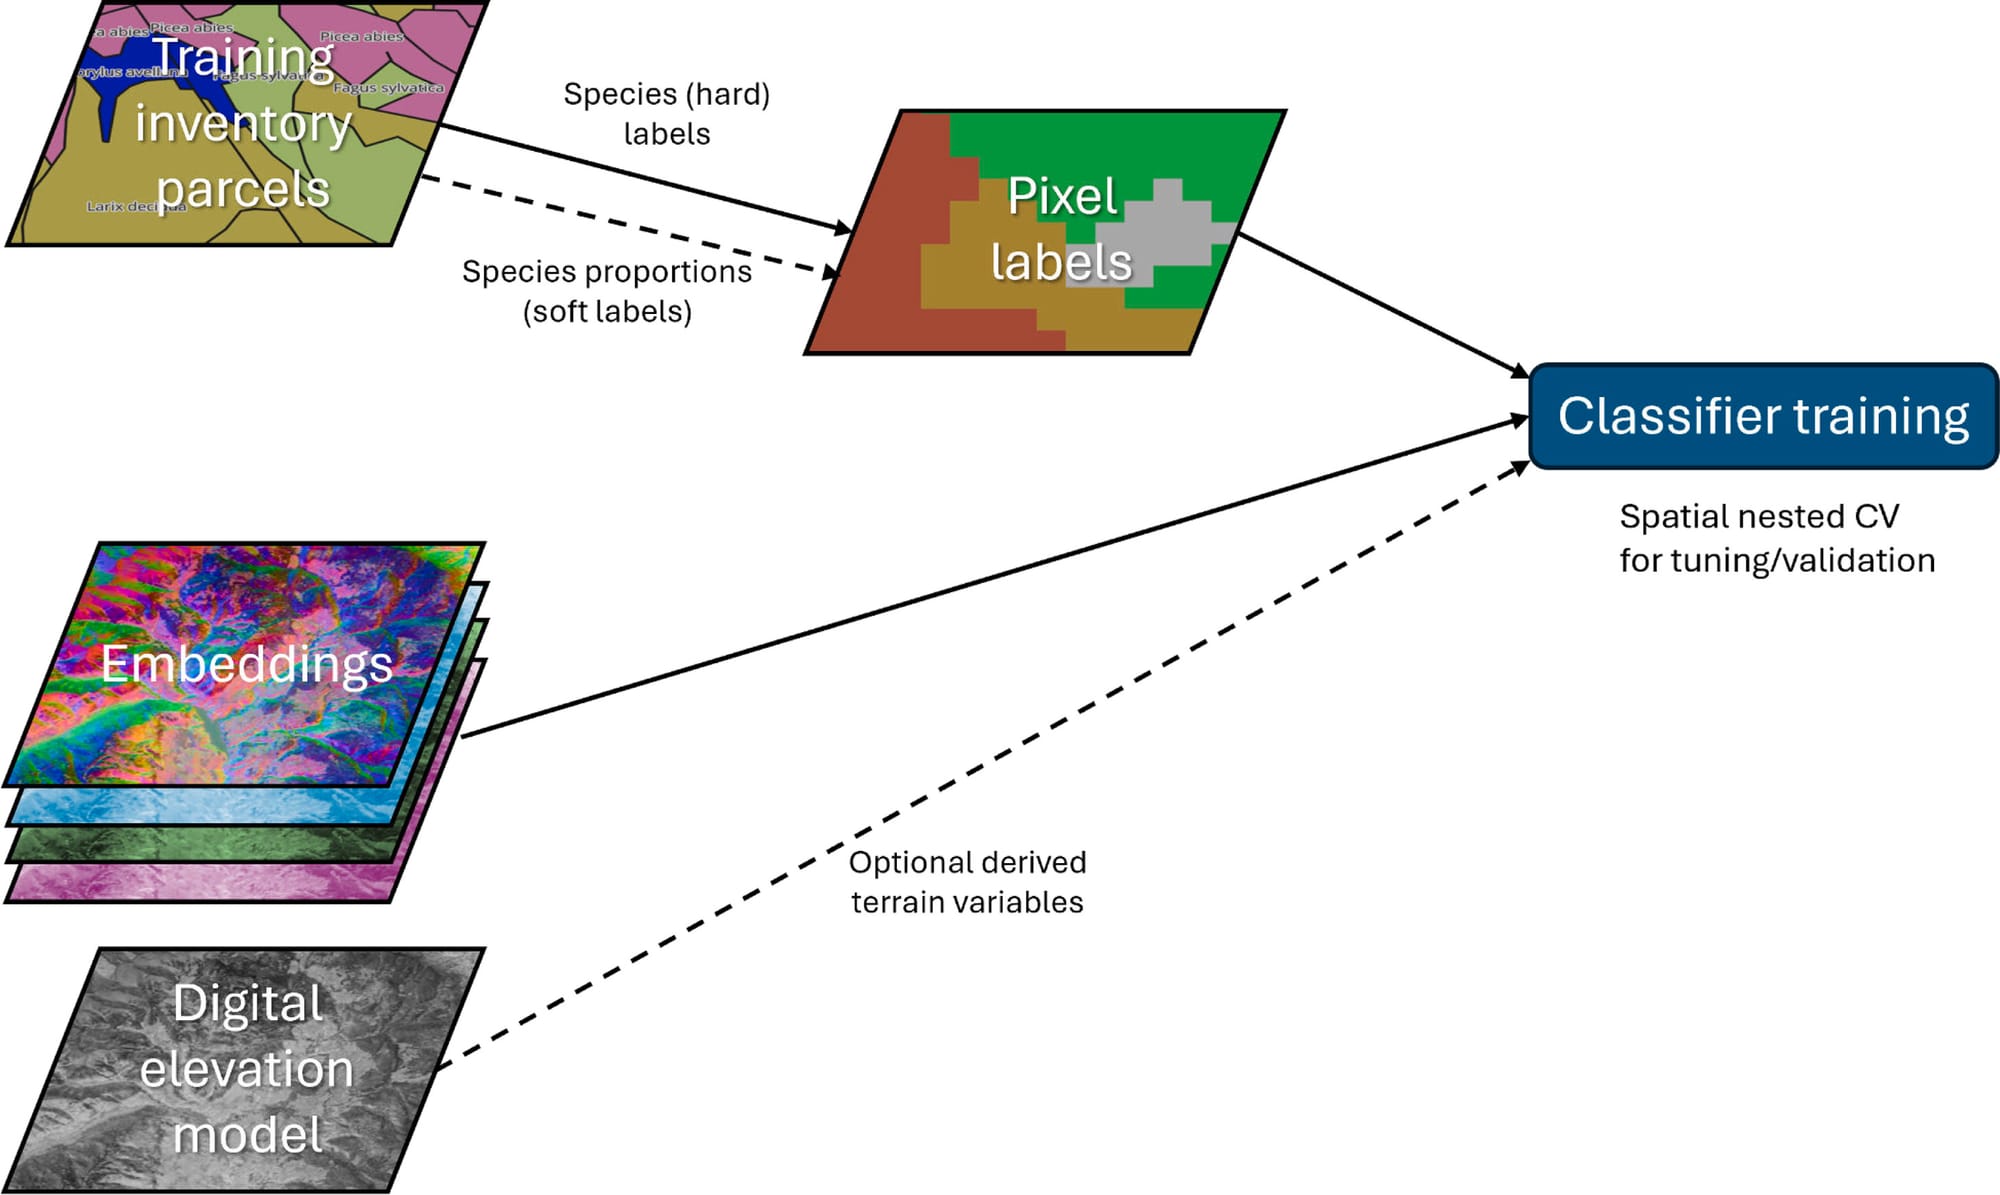
The Ball et al. (2026) study evaluated two GFMs, AlphaEarth and Tessera. AlphaEarth Foundations (AEF), developed by Google DeepMind, produces annual 64-dimensional embeddings for every 10 metre land pixel by ingesting Sentinel-1 radar, Sentinel-2 optical, Landsat, LiDAR structure, climate variables, gravity fields, and topography [9].
Tessera, developed at the University of Cambridge and open-sourced through the GeoTessera project, generates 128-dimensional embeddings by jointly modelling Sentinel-2 optical and Sentinel-1 radar time series, trained purely from remote sensing data without any ancillary environmental inputs [10]. Both models are pre-trained globally and can be applied to regional tasks without retraining from scratch — which is precisely what makes them compelling for species mapping in data-sparse regions.
What makes GFMs qualitatively different from conventional satellite composites is not just their resolution or sensor coverage, but the way they handle time. Traditional approaches collapse temporal variation into summary statistics — a seasonal median, an annual composite — which obscures exactly the phenological dynamics that are most informative for distinguishing species [11]. A model trained directly on satellite video sequences learns those dynamics rather than averaging them away.
Testing the theory in one of Europe's most demanding forests
The study was conducted in the Autonomous Province of Trento (Trentino) in northern Italy, as it presents a prime challenge for species identification. The province covers 6,207 km², approximately 60% of which is forested, spanning steep elevational, climatic, and biogeographic gradients that produce sharp transitions between distinct forest communities [12]. Broadleaved stands dominated by European beech give way to Norway spruce and silver fir in the montane belt, and to European larch and stone pine at subalpine elevations [13]. Mountainous topography introduces radar distortions, variable illumination, and snow seasonality that challenge satellite-based classification at every stage.
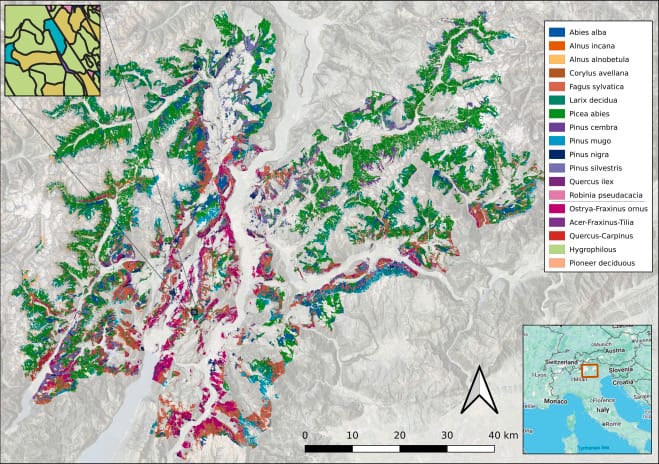
As ground truth (the basis from which to validate the GFMs), the study used the provincial forest assessment plan: 83,000 management units covering 260,000 hectares, in which trained foresters recorded tree species present and their proportional canopy cover through in-field visual inspection over more than a decade [14]. From this inventory, 18 species and species groups were defined: 13 dominant species retained as individual classes, and five community groups formed by merging ecologically co-occurring minor species [15].
GFM embeddings from AlphaEarth and Tessera were compared against conventional Sentinel-1+2 composites — both seasonal and annual — across five experimental dimensions: overall classification accuracy, label efficiency (how little training data is needed), sensitivity to label quality, the contribution of terrain data, and temporal transfer across years.
Five key findings
1. GFMs outperform conventional satellite composites, especially for rare species
Across experiments, GFM embeddings consistently outperformed conventional Sentinel-1+2 composites for species-level classification. Using the best-performing neural network configuration, AlphaEarth achieved a weighted F1 score of 0.833 and Tessera achieved 0.827, compared to 0.803 for the best conventional baseline (seasonal Sentinel-1+2) and only 0.745 for annual composites. On the macro F1 metric — which gives equal weight to all species regardless of how common they are, and is therefore the most relevant measure for rare-species discrimination — GFMs achieved 0.551 (Tessera) and 0.537 (AlphaEarth) against 0.503 for the seasonal baseline and 0.414 for annual composites.
The error structure reveals why this is: misclassifications are concentrated along taxonomic and functional axes; silver fir most often confused with Norway spruce, and pine species confused with each other, rather than distributed randomly. The embeddings have learned ecologically meaningful structure. High-recall species include Norway spruce (0.86), European beech (0.85), mountain pine (0.84), and European larch (0.82). The gains are most pronounced for phenologically distinctive species: black locust (Robinia pseudacacia), an invasive with a characteristic seasonal trajectory, achieves F1 of 0.75 with Tessera versus 0.66 with annual composites.
2. The models need very little training data
Perhaps the most operationally significant finding: GFM embeddings approach performance saturation using just 5% of available labelled training parcels. That corresponds to roughly 2,200 inventory parcels out of more than 43,000 available — a reduction in labelling requirement of approximately 95%.
This matters because field inventory data is expensive. Trained foresters recording species composition across 260,000 hectares over a decade represent a substantial investment that most forest regions in the world have not made and cannot afford to replicate. The finding that GFM representations already encode much of the species-discriminative structure — so that a downstream classifier needs only a fraction of the labels to unlock it — fundamentally changes the economics of species mapping. Conventional satellite composites continue to improve as more training data is added; GFMs reach a high ceiling much faster.
The caveat: label efficiency is better for common species than rare ones. Macro F1 — the rare-species metric — continues to climb more steadily with additional training data, confirming that discrimination of minority species remains the harder problem.
3. The models already know the terrain
Interestingly, adding elevation, slope, aspect, and topographic position index to the GFM embeddings produced no meaningful improvement in classification performance. Differences were consistently below 0.005 across all metrics for both AlphaEarth and Tessera.
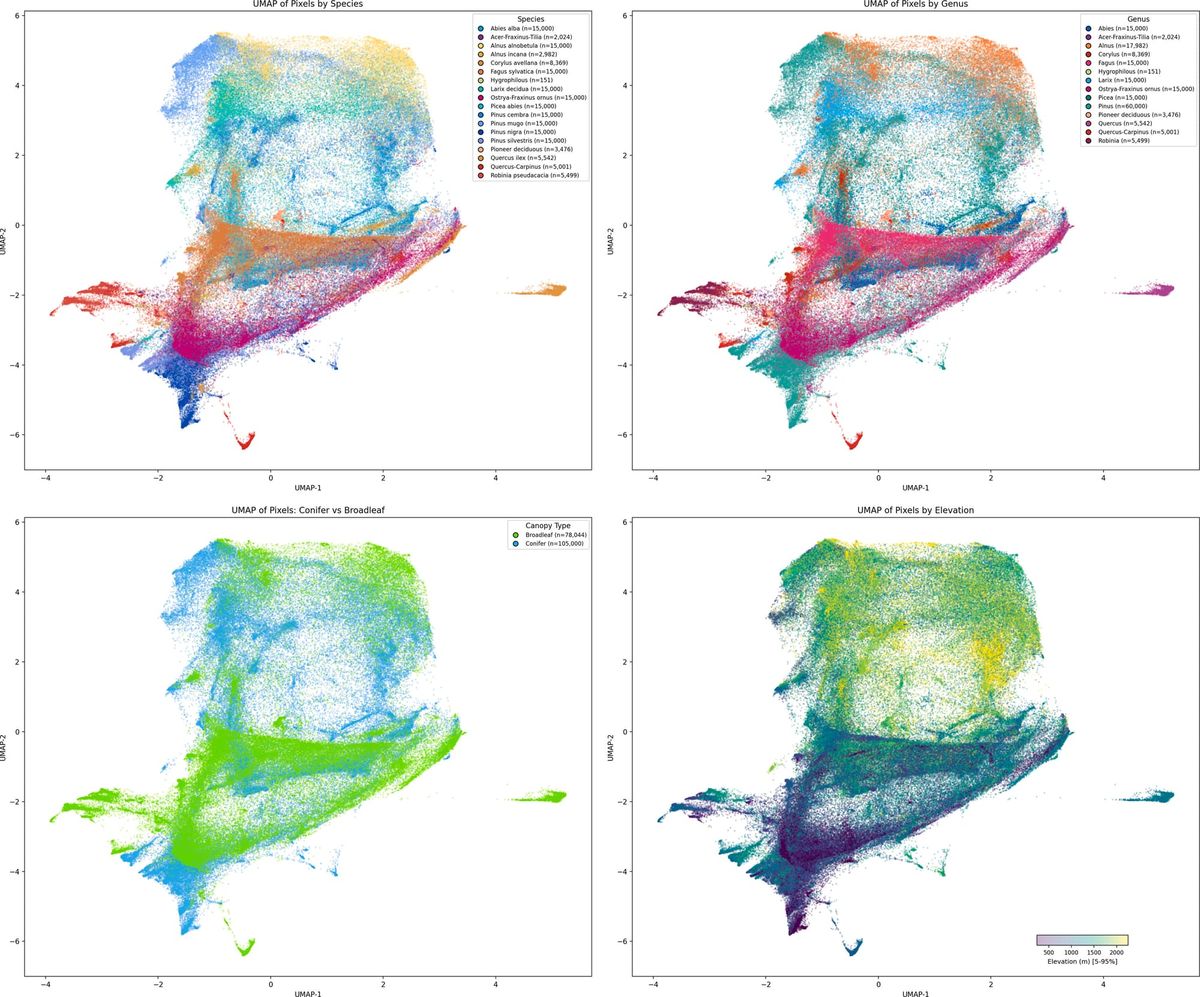
For AlphaEarth this is perhaps expected, as the model was explicitly trained on topographic targets and has likely encoded elevation information directly. For Tessera, trained purely on optical and radar time series with no environmental inputs, the null result is more striking. A visualisation of the Tessera embedding space using UMAP dimensionality reduction reveals why: elevation emerges as a dominant organising axis even though it was never provided as an input. The model has learned to infer topographic gradients from their ecological effects on canopy phenology, structure, and seasonal dynamics. The mountain, in effect, is already in the fingerprint.
The practical implication is that incorporating terrain data via simple feature concatenation adds pre-processing overhead, without delivering performance gains under these conditions.
4. Mixed-species data is an asset, not a problem
Forest inventory data almost always records multiple species per plot — practitioners typically convert this to a single "dominant species" label for model training, discarding the compositional information. This study tested whether using the full species proportions as soft labels — training the model to predict a probability distribution over species rather than a single answer — could recover some of that discarded information.
It can. Soft-label training achieved peak macro F1 of 0.586 for Tessera and 0.589 for AlphaEarth, compared to hard-label peaks of 0.581 and 0.565 respectively. The gains were concentrated in less common species that frequently occur as secondary components in mixed stands, which are precisely the species whose training signal gets suppressed whenever they are not the dominant species in a parcel. Under soft supervision, mixed-species parcels become informatively labelled training data rather than noise sources, eliminating the trade-off between label quality and data volume.
The broader implication is significant: most national forest inventories already record fractional species composition as a matter of course. The widespread practice of throwing that information away when converting to training labels has been discarding substantial signal. Existing inventory data is more valuable than previously assumed.
5. Year-to-year transfer is the remaining frontier
The study's most sobering finding is that, when classifiers trained on 2018 embeddings were applied to 2019 data without retraining, performance declined substantially. For Tessera, weighted F1 fell by 8.9% relative to within-year performance; for AlphaEarth, the drop was 14.1%. Macro F1 — the rare-species metric — fell even further: 19.4% for Tessera and 28.7% for AlphaEarth.
Tessera demonstrated greater temporal stability across the board, consistent with its purely remote-sensing-driven training capturing more temporally invariant features. But neither model achieves fully temporally invariant performance. Interannual phenological variation, differences in snow persistence and cloud availability, and changes in acquisition geometry all contribute to domain shift between years. The 2018–2019 year pair also coincided with Storm Vaia, which caused widespread windthrow across Trentino — making it difficult to fully separate representational drift from genuine landscape change.
The authors are clear about what this means: naïvely applying a static, single-year classifier across years risks conflating phenological variation with genuine compositional change. Addressing temporal transfer is the next critical frontier. Early results from Tessera V2 are encouraging on this front however, as the upcoming version will ship as a consistent series of global 10-metre annual embeddings covering 2017 to 2025, meaning classifiers that are trained on one year will not lose accuracy when predicting on another year, directly targeting the interannual domain shift identified here as the primary remaining bottleneck [16].
Why this matters beyond the Alps
The Trentino study is a proof of concept in a deliberately difficult setting. The implications extend well beyond one Italian province.
For carbon MRV: Species composition determines carbon sequestration rates, and yet most forest carbon methodologies rely on canopy cover and biomass estimates that cannot distinguish between a monoculture plantation and a biodiverse native stand. A system that can map 18 species at 10 metre resolution across a whole province — with a fraction of the usual training data — provides the data layer that high-integrity carbon credits require. The paper's wall-to-wall species map of Trentino (Fig. 8) represents a step beyond the genus-level products currently available at European scale [17].
For EUDR compliance: The EU Deforestation Regulation's definition of forest is not simply about canopy cover, it asks what was growing and what type of forest it was. Species-level composition data at the resolution this research demonstrates is the evidential layer that most current EUDR compliance solutions do not yet reach.
For biodiversity and nature finance: TNFD, SBTN, and biodiversity credit methodologies all ultimately ask: what is actually there? Species-level maps produced at landscape scale are the foundation of any credible biodiversity baseline. The finding that existing forest inventory data — already collected in many countries — can be leveraged more effectively through soft-label training means that the path from existing data assets to actionable biodiversity maps is shorter than it appeared.
The bottleneck has shifted
The paper closes with a finding that deserves to sit at the centre of how the forest monitoring community thinks about the next five years. Geospatial foundation models have shifted the primary bottleneck in species mapping from feature engineering toward the availability, quality, and temporal alignment of reference data.
For decades, the limiting factor was the satellite signal itself. The question remained how to extract species-discriminative information from multispectral composites that were never designed for the task. That problem is now substantially solved. The limiting factor is now the training labels: how many exist, how accurate they are, how well they transfer across time.
That is a fundamentally different kind of problem, and one that forest inventory programmes, remote sensing research teams, and companies building on this technology are now well placed to address together.
The full paper — "Geospatial foundation models enable data-efficient tree species mapping in temperate mountain forests" — is published open access in Science of Remote Sensing. The Tessera embedding model and associated code are available open-source through the GeoTessera project.
References
[1] Ball, J.G.C., Wicklein, J.A., Feng, Z., Knezevic, J., Jaffer, S., Madhavapeddy, A., Atzberger, C., Dalponte, M., Coomes, D.A. (2026). Geospatial foundation models enable data-efficient tree species mapping in temperate mountain forests. Science of Remote Sensing, 14, 100466.
[2] Tilman, D., Kinzig, A.P., Pacala, S. (2013). The Functional Consequences of Biodiversity. Princeton University Press; Brockerhoff, E.G. et al. (2017). Forest biodiversity, ecosystem functioning and the provision of ecosystem services. Biodiversity and Conservation, 26(13), 3005–3035.
[3] Dalponte, M., Bruzzone, L., Gianelle, D. (2012). Tree species classification in the Southern Alps based on the fusion of very high geometrical resolution multispectral/hyperspectral images and LiDAR data. Remote Sensing of Environment, 123, 258–270.
[4] Weiss, D.J., Walsh, S.J. (2009). Remote sensing of mountain environments. Geography Compass, 3(1), 1–21.
[5] Wang, D. et al. (2022). An empirical study of remote sensing pretraining. IEEE Transactions on Geoscience and Remote Sensing, 61, 1–20.
[6] Blickensdörfer, L. et al. (2024). National tree species mapping using Sentinel-1/2 time series and German national forest inventory data. Remote Sensing of Environment, 304, 114069.
[7] McRoberts, R.E., Tomppo, E.O., Næsset, E. (2010). Advances and emerging issues in national forest inventories. Scandinavian Journal of Forest Research, 25(4), 368–381.
[8] Xiao, A. et al. (2025). Foundation models for remote sensing and earth observation: A survey. IEEE Geoscience and Remote Sensing Magazine, 2–29.
[9] Brown, C.F. et al. (2025). AlphaEarth foundations: An embedding field model for accurate and efficient global mapping from sparse label data. arXiv:2507.22291.
[10] Feng, Z. et al. (2025). TESSERA: Temporal embeddings of surface spectra for earth representation and analysis. arXiv:2506.20380.
[11] Xu, K. et al. (2021). How spatial resolution affects forest phenology and tree-species classification based on satellite and up-scaled time-series images. Remote Sensing, 13(14), 2716.
[12] Agnoletti, M., Biasi, R. (2013). Trentino alto adige. In Italian Historical Rural Landscapes. Springer Netherlands.
[13] Gasparini, P. et al. (Eds.) (2022). Italian National Forest Inventory — Methods and Results of the Third Survey. Springer International Publishing.
[14] Dalponte, M., Andreatta, D. (2026). A spatially explicit dataset of upper canopy tree species composition of public forests of the Autonomous Province of Trento, Italy. Data in Brief, 66, 112736.
[15] Ball, J.G.C. et al. (2024). Harnessing temporal and spectral dimensionality to map and identify species of individual trees in diverse tropical forests. bioRxiv, 2024.06.24.600405.
[16] Feng, Z. et al. (2026) Tessera V2. https://arxiv.org/abs/2607.03949
[17] De Keersmaecker, W. et al. (2024). ForestPaths: European tree genus map. Zenodo.